Scientists write lab reports to show the results and importance of an experiment. Writing lab reports helps you make sense of the results, connect them to your course content, and communicate your findings to others. Follow this outline to structure your report. However, always refer to your assignment guidelines to ensure you are meeting your Professor’s expectations.
1. Title Page
Include your name, your student number, the date, and the title of the experiment.
2. Abstract
Summarize the important parts of the lab report. Describe the:
❑ Purpose of the experiment
❑ Methods and materials
❑ Results
❑ Significance of the results
Do not include references or definitions in the abstract.
3. Introduction
Help the readers understand the background of the experiment and what you were doing through the experiment. Try answering these questions:
❑ What is the relevance of your experiment?
❑ What are the supporting theories or topics involved?
❑ What was the purpose of your experiment?
❑ How did each of the parts of your experiment help you achieve the purpose?
Sample Introduction
This example highlights the general format of an introduction. The comments identify each of the introduction’s key parts.
Western blotting is often used in molecular biology to identify the presence of proteins based on their size and affinity to specific antibodies. In this experiment, the identities of various animal samples were determined through a Western blot comparison of myosin light chain specimens. By comparing the experimentally determined protein sizes to a database of known proteins and their origins, the identities of the samples were found.
The first sentence identifies a key technique and its relevance to Biology.
The second sentence states the purpose of the experiment.
The third sentence explains how the purpose of the experiment was achieved.
4. Materials and Methods
Give enough information to your readers so that they can replicate your experiment. Describe what you used and what you did in the experiment.
5. Results
Present your key findings and observations without analyzing them. Describe your results using sentences and include tables, figures, and graphs. Make sure that you include captions for your tables, figures, and graphs.
| Write captions above tables: | Write captions below figures/graphs: | ||||||||
Table 1: Average participant heart rates
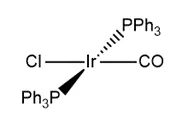
| Figure 1: Structure of Vaska’s complex  | ||||||||
| If you have calculations, you can show one full calculation and put the rest of the values in a table. |
6. Discussion
Analyze and interpret your results. You can compare your results to theory, literature values, and other experimental work.
Try answering these questions:
❑ What were the expected results and how do they connect to relevant theories?
❑ How do your results to what was expected? Why are there differences?
❑ What were sources of error or limitations in the experimental design? How did these affect your results and how can you minimize these errors in the future?
7. Conclusion
State your key findings from the experiment and mention any limitations or suggestions to improve the experiment.
8. References
Provide citations for any information that is not your own. Make sure that you include intext citations. Use the citation style that your Professor requests.
